Home Page featured articles
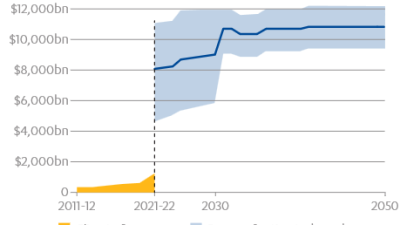
At midnight on Sunday 23rd February 2025, USAID (the world’s largest provider of international aid – circa $69 billion) was effectively shut down
A recent report form the city of Buenos Aires measuring multi-dimensional poverty, using the consensual method, has found that in 2019,15.3% of households were multi-dimensionally poor, rising to 25.7% for households with children under 18 years of age. The method established will be used to measure nu,ti-dimensional poverty on an ongoing basis.
We are now delighted to offer you the presentation slides and video recordings of sessions across the three days, featuring formal presentations, interactive Q&As, networking opportunities and much more.


 PSE:UK is a major collaboration between the University of Bristol, Heriot-Watt University, The Open University, Queen's University Belfast, University of Glasgow and the University of York working with the National Centre for Social Research and the Northern Ireland Statistics and Research Agency. ESRC Grant RES-060-25-0052.


