The European Union carries out, on a regular basis, detailed surveys in all member states of poverty and social exclusion, the European Union Statistics on Income and Living Conditions (EU-SILC) surveys. These have included modules on material deprivation drawing on the concept of publicly perceived necessities. Read about the new material deprivation index under European Union - 2017 and the new Child Deprivation index under European Union - 2018, in the left hand menu.
Background and overview
In 2007 the EU conducted a survey into attitudes to necessities to explore whether the concept of socially perceived necessities (see consensual method) could be utilised across the member states. This 2007 survey enabled direct comparisons on people's attitudes to what items and activities count as necessities to be made across a wide range of countries with different cultural backgrounds and different levels of economic development and is therefore a comprehensive test of the idea of socially perceived necessities. It found considerable agreement across member states, despite the cultural and economic differences, and since 2009, the EU-SILC surveys have used a set of indicators of material deprivation, based on this commonly agreed list of necessities. Those classed a materially deprived were those who could not afford these necessities (as opposed to those who chose not to have that item), utlising the concept of an enforced lack of necessities as developed in Breadline Britain surveys (Mack and Lansley, 1985).
Access to the material deprivation data sets can be found on here on the Eurostat website. Below, under Tables of necessities, you can find details on a country by country basis of people's attitudes to necessities in the different member states.
The 2007 EU attitudes to necessities survey differs from the 'Breadline Britain' and Poverty and Social Exclusion' surveys in that people are asked to distinguish between 'absolutely necessary' and 'necessary' whereas in the Breadline Britain and PSE surveys tonly the concept of 'necessary' was used. The EU asked the following question about 74 items that cover all aspects of living, both social and material:
We would like to understand better what, in your view, is necessary for people to have, what can be considered as an acceptable or decent standard of living in [your country]. For a person to have a decent standard of living in [your country], please tell me how necessary do you think it is to … ?
The potential answers were:
- Absolutely necessary, no one should have to do without
- Necessary
- Desirable but not necessary
- Not at all necessary
- Don’t know.
The survey is reported in a Special Eurobarometer, Poverty and Exclusion 2007 (pdf). Details of the thinking behind the 2007 EU survey of socially perceived necessities can be found in What can be Learned from Deprivation Indicators in Europe (Anne-Catherine Guio, IWEPS, Belgium, 2009, Eurostat, Luxembourg). In February 2012, Anne-Catherine Guio, David Gordon and Eric Marlier made a presentation to Eurostat on measuring material deprivation in the European Union.
Further analysis of the material deprivation data sets has enabled a more detailed understanding of patterns of deprviation and people's expenditure priorities. See, for example, Deutsch, J., Guio, A.C. Pomati, M. and Silber, J. (2014) “Material Deprivation in Europe: Which Expenditures Are Curtailed First?” (Social Indicators Research Vol. 120(3) 723-740). This analysis concludes that: "People generally first cut back on their annual holidays, then their savings to face unexpected expenses, new furniture, leisure and social activities. Those experiencing higher levels of Material Deprivation tend to also be unable to afford a meal with proteins, a warm house and paying bills, and eventually even two pairs of properly fitting shoes.”
Tables of necessities
You can explore attitudes to necessities in all the member states of the European Union in the tables and maps below. The data is drawn from a Special Eurobarometer, Poverty and Exclusion 2007 and show the percentages thinking an item is an absolute necessity.
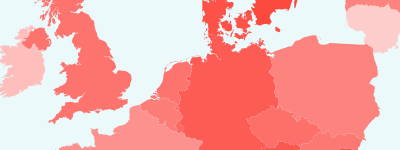
Colour gradients are applied across all items to show what percentage of a member state’s population (or sector of that population) agrees that a particular item is ‘absolutely necessary’. The percentages are shaded so that where 100 per cent think an item is ‘absolutely necessary’ it is shaded deep red. This gradually changes to very light red for 51 per cent through to white for 50 per cent. The colours then change to very light green for 49 per cent through to deep green for 0 per cent. So the more uniform the shading, the more agreement there is. This produces what’s called a ‘heatmap’.
You will see that although there is some variation between countries as to what is seen as ‘absolutely necessary’, there is considerable consensus. In particular, most member states agree as to the order of the items from most necessary to least necessary.
In the tables below you can choose which country will determine the order of the items from most necessary at the top to least necessary at the bottom. The items are initially ordered by an average of all 27 EU member states.
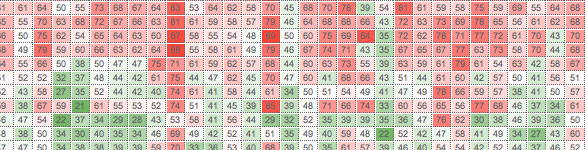
Table of necessities in Europe by member state – adult items (opens in a new window)
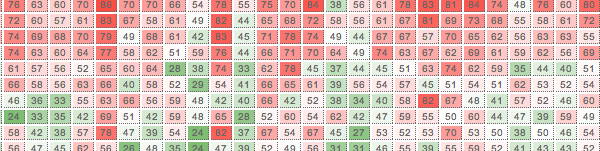
Table of necessities in Europe by member state – children’s items (opens in a new window)
In the map below of European Union countries you can choose which item to examine from the list on the left-hand side. For each item chosen, the map shows the percentage of the population in each country regarding that item as an absolute necessity.

Further surveys
In 2009, the EU statistical office undertook a follow-up survey into the public’s perceptions of the causes of poverty, adequacy of services and ways to tackle poverty. Special Eurobarometer 321, Poverty and Social Exclusion 2009 provides full details of the findings of this survey.
This page was first published on 03 August, 2012 and updated on 23 October, 2017