What are the necessities of life?
The PSE project looks at what the public think makes an unacceptably low standard of living in the UK today.
It follows similar surveys in Britain 1983, 1990 and 1999 and in Northern Ireland in 2002/3. In the PSE 2012 necessities of life survey, people were given a list of 76 items (46 for adults and 30 for children).
They were asked to choose between those which are ‘necessary and which all people should be able to afford, and which they should not have to do without’ and those which ‘may be desirable but are not necessary’.
Before being included in the survey, the list of items was first discussed in depth with ‘focus groups’ from across the UK to make sure they reflect what different groups think are important. Of the items and activities tested, 25 adult items and 24 child items are seen to be ‘necessary’ by a majority. Table 3.1 shows some of these.
Table 3.1: Examples of necessities chosen
| For adults over 75% agree |
For children over 75% agree |
| Repair or replace broken electrical goods |
Garden or outdoor space to play |
| Go to weddings, funerals and other such occasions |
Suitable place for homework |
| Telephone |
Child hobby or leisure activity |
| For adults over 50% agree |
For children over 50% agree |
| Household contents insurance |
Computer and internet for homework |
| Adult hobby or leisure activity |
Day trip with family once a month |
| Be able to pay unexpected costs of £500 |
Pocket money |
 View the full list for adults and children: Attitudes to Necessities UK.
The public think poverty is about more than the basics
of children in the Tyne-Tees and Yorkshire live in a home that is cold or damp or both
The public do choose items essential for survival, such as adequate food and a warm, dry home. Top of the list for adults come:
- 96% Heating to warm living areas of the home
- 94% Damp-free home
- 91% Two meals a day for adults
And for children:
- 97% Warm winter coat
- 96% Fresh fruit and veg once a day
- 93% New, properly fitting shoes
of us think we should be able to visit family and friends in hospital
But they also choose a range of items beyond these basic needs. These include consumer goods, such as a washing machine and a telephone. They also include social activities:
- 90% choose ‘visiting friends/family in hospital’
- 79% choose ‘being able to afford to attend a wedding/funeral or other such occasions’
And people also give high priority to educational and social items for children:
- 92% choose ‘books suitable to age’
- 92% choose ‘garden or outdoor space to play safely’
- 88% choose ‘hobby or leisure activity’
Agreement about what children need is high
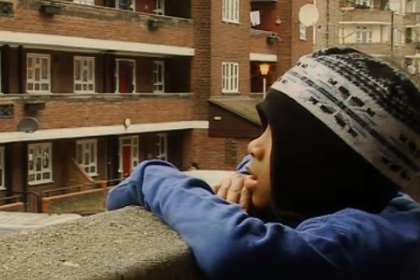
It feels like I am in a cell because I only get to stay inside the house.
There is greater agreement about what children need than about adults. Of the 24 child necessities, eight child items were chosen as necessities by more than 90% of those interviewed. A further four received 80% backing.
Of the 25 adult necessities, four were seen as necessities by over 90% and a further five by 80%. However, there are clear limits to what people think of as necessities.
Only 10% think a dishwasher is a necessity and fewer than this choose branded trainers or an MP3 player as necessities for children. Only 27% think children aged 11 or over must have a mobile phone.
The public take a 'relative view' of poverty
There are different ways of defining poverty. Official measures of poverty mostly look at income. The PSE approach looks directly at living standards and finds out what items and activities the majority of people think should be part of a minimum contemporary standard of living. It establishes whether people take:
- an ‘absolute’ view of poverty, which only includes physical essentials like food and shelter, or
- a ‘relativist view’, which includes other aspects of life, social as well as material.
My friends talk about what they did on holiday. And I get really jealous because I can’t go.
In each of the five surveys, the public has taken a clear ‘relativist’ view. That is, they accept that a minimum standard is not just about subsistence. They back the view that it should enable people to participate fully in the society in which they live. Peter Townsend pioneered this view, that the core feature of poverty is being ‘excluded from ordinary patterns, customs and activities’.
People also think that minimum standards should reflect contemporary standards. Some consumer items, such as a washing machines or phones, have become much more widespread over the last 30 years. The proportions of people selecting these as necessities have also risen substantially. Other items which weren’t available to the ordinary consumer 30 years ago, such as home computers, mobile phones and internet access, are now close to being considered necessities for everyone. Indeed, two-thirds of UK adults now believe that children need a computer and internet access at home.
 Jenny and her children describe how they feel about not being able to afford the same things as other people.
think children should have a computer and internet for homework
Necessities change over time
The public clearly thinks that living standards must reflect how we live today, not how we lived in the past. As society changes, new things become necessities.
There have been several changes in the list of items being tested over the years. The number of items went up from 35 in 1983 to 76 in 2012. The 1983 and 2012 surveys have 21 items in common.
Of the adult items, only one became a necessity over the period of 29 years. This was the telephone, which rose from 43% in 1983 to 77% in 2012. But some have risen sharply, with others dropping down the list (see Table 3.2).
Table 3.2: Some of the changes between the surveys
| Necessities |
Previous surveys |
2012 |
| Two meals a day (adults) |
64% (1983) |
91% |
 |
| Telephone |
43% (1983) |
77% |
| Car |
22% (1983) |
44% |
| Home computer |
5% (1990) |
40% |
| Mobile phone |
8% (1999) |
40% |
| Internet access |
6% (1999) |
41% |
| Two pairs of all-weather shoes |
78% (1983) |
54% |
 |
| Roast joint or equivalent |
67% (1983) |
36% |
| Holiday away (adults) |
63% (1983) |
42% |
| New, not secondhand, clothes (adults) |
64% (1983) |
46% |
| Presents |
63% (1983) |
46% |
 View the trends in attitudes to necessities 1983 to 2012.
 View the trends in attitudes to child necessities 1999 and 2012.
Why have our views changed?
Over the four surveys covering Britain, the public became more generous between 1983 and 1999, though at a slower rate between 1990 and 1999. But they then became less generous overall between 1999 and 2012. And in the two surveys covering Northern Ireland there has been a sharper drop between 2002/3 and today. This fall reflects the wider mood of austerity, and a year in which a significant proportion of households both were poorer and felt poorer than just a few years before. The public lowered their view of a minimum living standard in the colder economic climate of 2012. In particular, a number of the activities and items for adults rose between 1983 and 1999 but then dropped back, with some no longer seen as necessities (see Figure 3.1).
Only one of the children’s activities was asked about in 1983, having ‘children’s friends around for tea’. While this rose from 37% in 1983 to 53% in 1999, it has since dropped back to 49% today.
Figure 3.1: Adult activities have risen and fallen again
Several items may have fallen because taste has changed. For example, since the 1980s, a ‘roast joint’ has become a less popular meal, there is less stigma about secondhand clothes, and many people prefer wearing trainers to shoes.
Looking at trends in Britain over the last 30 years suggests that:
- what we think of as a necessity broadly follows wider improvements in living standards but rises more slowly than the overall rise in prosperity
- the current harsh economic times have reduced minimum expectations
There is a consensus on what we need
Different groups in society are in strong agreement about what we need to enjoy a minimum standard of living. This high level of agreement between different groups has been found in all the past surveys over the last 30 years both in Britain and Northern Ireland. It is integral to what has become known as the ‘consensual method’, confirming that there is a minimum standard that applies to, and is agreed by, all groups in society.
The 2012 survey again found that across gender, ethnicity, occupation, income level, education, housing tenure and family type, there are very similar views on the relative importance of different items and activities. For all the items and activities considered, there are very few instances where the majority of one group in society considers an item a necessity which is not also seen as a necessity by all other groups.
Graduates and those with no qualifications differ, for example, on only three items. Graduates think regular payments to an occupational or private pension, and taking part in sporting activities are necessities, but those with no qualification do not. People from different ethnic groups have very similar views. The most striking difference is on whether attending a place of worship is a necessity: only 27% of those who class themselves as white think it is while 62% of non-whites do.
Figure 3.2: Disagreement between groups over television as a necessity
There are also very few regional and national differences. Those in the south of England, the north of England and Wales, Scotland, and Northern Ireland show very high levels of agreement over which items should be regarded as necessities. The differences are greatest between the South of England and Northern Ireland, with people in Northern Ireland being overall slightly less likely to see an item or activity as a necessity.
The one item which seen as a necessity by a majority overall where there is some disagreement across groups is a television. This is more important to those groups more likely to be in poverty (see Figure 3.2).
Political affiliation doesn’t matter
Views about what is a necessity are also almost identical no matter which political party someone supports. For all 46 adult items, whether they were seen as necessities or not, there were no significant differences between those who saw themselves as Conservative or Labour supporters.
Agreement about the 30 children’s items is also high. Of children’s items seen as a necessity overall, there is only one where there is significant disagreement. 61% of Labour supporters think children need at least four pairs of trousers, leggings, jeans or jogging bottoms, compared with 48% of Conservative supporters.
An age divide?
Figure 3.3 Over-65s have different views
People of different ages differ most. Older people see four items as a necessity which are not seen so by the population as a whole (see Figure 3.3).
On the other hand, younger people see mobile phones as much more important than others, in particular older people. 53% of those aged 16-24 think these a necessity compared with 33% of those over 65.
Coming up

More data on attitudes to necessities will be published shortly including differences between groups.
Detailed PSE UK papers on the lack of necessities will also be published soon. These papers will also explore if money is the only reason for going without. The PSE survey also finds out about people who lack items and activities because they 'don’t want’ them and those who want to take part but can't for other reasons than lack of money. There will be further analyses of the barriers to participation later in the year.
About the surveys
The PSE:UK 2012 research draws on two surveys both carried out by the National Centre for Social Research (NatCen) in Britain and by the Northern Ireland Statistics and Research Agency (NISRA) in Northern Ireland.
- The ‘living standards’ survey was carried out between March and December 2012 and covered 5,193 households (4,205 in Britain and 988 in Northern Ireland) in which 12,097 people were living (9,786 in Britain and 2,311 in Northern Ireland).
- The ‘Necessities of Life’ survey was carried out between May and June 2012 and is based on a sample of 1,447 adults aged 16 or over in the Britain and 1,015 in Northern Ireland.
Read more about the research approach here.
See also the PSE: UK team's first report 'The impoverishment of the UK'.


 PSE:UK is a major collaboration between the University of Bristol, Heriot-Watt University, The Open University, Queen's University Belfast, University of Glasgow and the University of York working with the National Centre for Social Research and the Northern Ireland Statistics and Research Agency. ESRC Grant RES-060-25-0052.


