The government has consistently argued that under the government spending review those with the broadest backs would take the heaviest burden – that the package would conform to the principle of 'progressive austerity'. However, two independent studies, the first by the Institute for Fiscal Studies and the second by Tim Horton and Howard Reed for the TUC, challenge this assessment, finding that the overall impact of the spending review is regressive.
The government's plans, as announced in the 2010 spending review, involve a number of tax rises – especially the rise in VAT to 20 per cent from January 2011 – and an £81 billion package of spending cuts.[1] These are needed, the Coalition argues, to close the fiscal deficit inherited from Labour.
As part of the announcement, the Treasury included its own analysis of the distributional effects of part of the package. This was the first time it had conducted such a 'distributional impact' analysis. They divided the population into ten equal-sized income groups or deciles and then measured the impact on each group. This analysis claimed that the effect of the package would be 'progressive', that it would hit the richest harder than the poorest.[2]
This finding was subsequently challenged by two independent assessments of the impact of the package, the first by the Institute for Fiscal Studies (IFS) and the second in a study by Tim Horton and Howard Reed commissioned by the TUC.
The IFS study disagreed with the Treasury's claim that the overall package of tax and benefit changes is progressive. As Carl Emmerson, Acting Director of the IFS, has said:
Our analysis continues to show that, with the notable exception of the richest 2%, the tax and benefit components of the fiscal consolidation are, overall, being implemented in a regressive way. But this is not to say that it is unfair: fairness will always be in the eye of the beholder.[3]
The analysis undertaken by the IFS differs in two main ways from the Treasury's:
- The Treasury included in its analysis the package of tax and benefits cuts already announced by Labour before it left office. Some of these were highly progressive, notably the introduction of a new top rate of income tax to 45 per cent. The IFS analysis has excluded all the changes announced by the previous government, and thus measures only the impact of the changes made by the incoming government and announced on 17 October.
- The Treasury analysis also excluded about a third of the proposed benefit changes, notably the effect of some cuts to housing benefit, Disability Living Allowance and council tax benefits that will hit the bottom half of the income distribution more than the top half. The IFS attempts to reflect the impact of all the benefit cuts announced in the October Budget.[4]
The effect of making these adjustments is that the tax and benefits package turns from being broadly progressive to being broadly regressive in impact. As the IFS analysis put it, 'This shows that, once all of the benefit cuts are considered, the tax and benefit changes announced in the October Budget are clearly regressive as, on average, they hit the poorest households more than those in the upper-middle of the income distribution in cash, let alone percentage, terms.'[5] Indeed, the heaviest losers were shown to be families with children, with those in the bottom decile losing 7 per cent of their income by 2010–15.[6]
The IFS's analysis was subsequently attacked by the Deputy Prime Minister Nick Clegg as 'distorted and a complete nonsense.' He singled out the methodology they had used for allocating the benefits cuts, which had been excluded from the Treasury's analysis.[7]
The analysis by Horton/Reed set out to take the Treasury and the IFS studies a stage further by including an attempt to measure the distributional impact of the public spending cuts as well as the tax and benefit changes. The Office for National Statistics already publishes an annual study, The Effects of Taxes and Benefits. This analyses the distributional impact of personal taxes and benefits and of the distribution of spending on 'benefits in kind' such as health and education services and housing subsidies.[8]
The ONS study provides only a partial view of the distributional impact of public spending. It only analyses about half of public spending and its allocation of some spending across households is made on the basis of fairly crude formulae, rather than households' use of these services. For example, health spending is allocated according to the age and gender of household members, rather than actual use of health services.[9] Another study by Tom Sefton of the London School of Economics has sought to improve on these ONS calculations by incorporating data from a wider range of surveys and apportioning spending according to households' reported use of services.[10] Nevertheless, both the ONS and Sefton study still only analyse around half of total public spending.
Horton/Reed have developed this methodology. Their study allocates the components of public spending by households on the basis of their propensity to use those services. Those services that are not consumed individually but collectively – such as defence and environmental protection – are allocated on a flat-rate basis. Altogether, their study allocated about 70 per cent of total public spending (of £555 billion in 2007/8) on an individual household basis and 30 per cent on a flat-rate basis. Figure 1 shows that, on this basis, the distribution of public spending (both benefits and tax credits and all other spending) is highly progressive, being of much greater benefit to the poorest than the richest households.
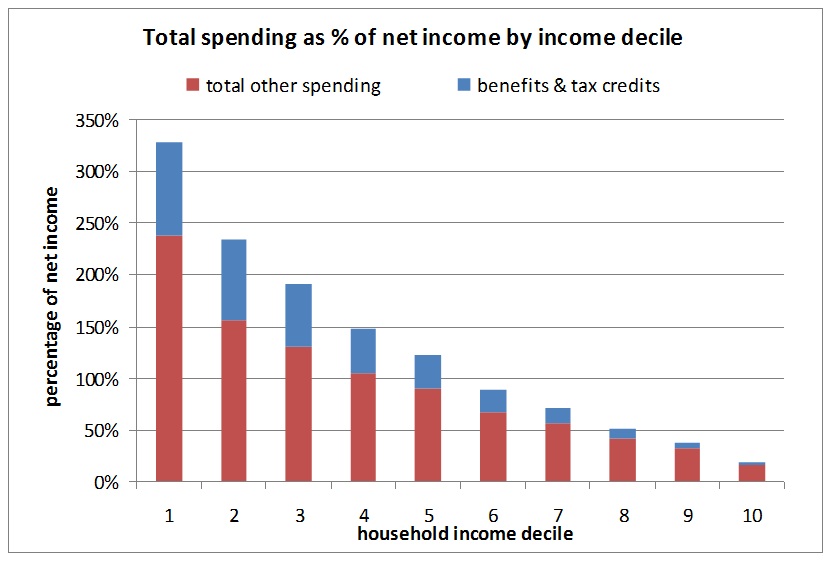
Figure 1: The distribution of public spending by income. Note: Average annual spending per household, as a proportion of net household income, by household income decile (2007–08).
Source: Tim Horton and Howard Reed, Where Does the Money Go?, TUC, 2010.
Horton and Reed then applied these findings to examine the full impact of the government's spending review. Figure 2 shows the combined effect of the two sets of changes, the tax and welfare changes (based on the IFS analysis ), and the spending cuts (calculated by Horton/Reed). Both sets of changes are regressive. Their combined impact is equivalent to a loss of around 38 per cent of net income for households in the poorest decile and 5 per cent for those in the top decile. While both sets of changes are regressive when considered in isolation, the impact of the spending cuts is much more regressive than that of the tax and benefit changes; and it is the impact of these spending cuts that predominantly shapes the pattern of the overall impact. This is because the magnitude of the spending cuts is much greater than that of the tax increases and benefit cuts.
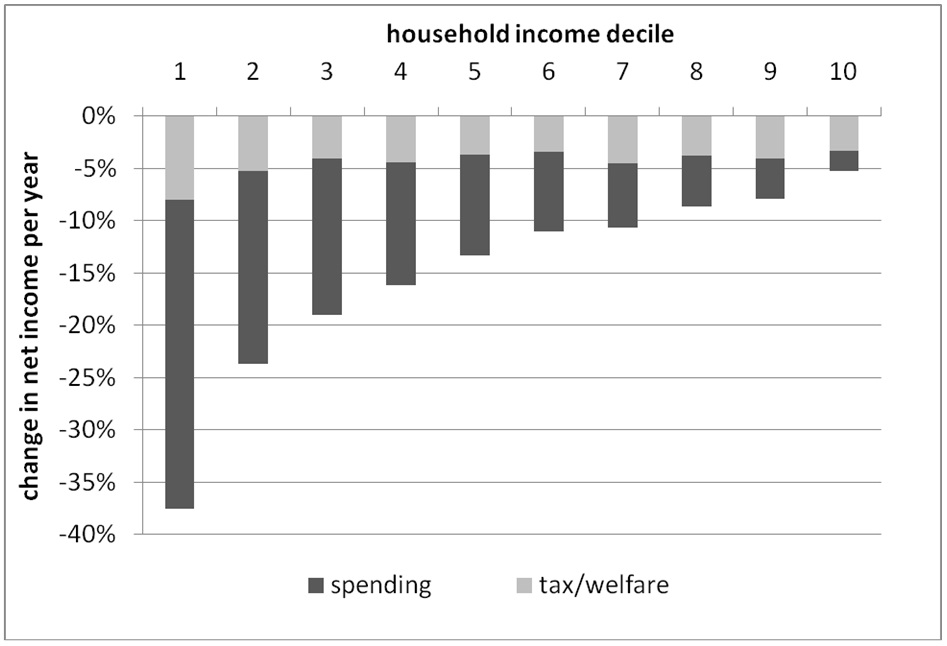
Figure 2: Overall impact of fiscal consolidation: spending cuts and tax/welfare measures.
Source: T. Horton and H. Reed, 'The Distributional Impact of the 2010 Spending Review', Radical Statistics, 203, November 2010; J. Browne and P. Levell, 'The distributional effect of tax and benefit reforms to be introduced between June 2010 and April 2014: a revised assessment', Institute for Fiscal Studies, October 2010; the calculations are based on the impact of the cuts in 2012/13.
This will not be the final word on this subject. Each of these studies is based on a number of assumptions about how to allocate tax rises, benefit cuts and cuts in public services. None of these is straightforward to quantify, especially in the case of public services. As the IFS has concluded, '… the existing studies which have attempted to evaluate the progressivity or regressivity of spending cuts must be interpreted very cautiously'.[11]
Endnotes
- Cm 7942, Spending Review 2010, HM Treasury.
- Ibid., see especially chart B3 in the annex.
- Opening remarks by Carl Emmerson at the Institute for Fiscal Studies briefing on the Spending Review, 21 October 2010.
- The Treasury analysis also did not stretch until 2014–15 when the full impact of the cuts would be felt.
- Brown, J. and Levell, P. (2010) The Distributional Effects of Tax and Benefit Reforms to be Introduced Between June 2010 and April 2014: A Revised Assessment, London, Institute for Fiscal Studies.
- Ibid.
- Nick Clegg, Guardian, 22 October 2010.
- For the latest version, see Barnard, A. (2009) The Effects of Taxes and Benefits on Household Income, 2007/08, Newport, Office for National Statistics.
- This is because the Office for National Statistics' study is based on the Expenditure and Food Survey, which does not contain information about use of health and education.
- This approach therefore takes into account variations in households' service use by characteristics over and above age and gender, such as income, tenure, etc. See, for example, Sefton, T. (2002) Recent Changes in the Distribution of the Social Wage, CASEpaper 62, London, London School of Economics.
- O'Dea, C. and Preston, I. (2010) Can We Assess the Distributional Impact of Cuts to Spending on Public Services?, London, Institute for Fiscal Studies.