-
Who are the poor?
Of those who are deprived, most are in work.
Download the csv files.

-
Examine key data from the PSE: UK research surveys carried out in 2012
You can download our data in .csv format.
Visit the data visualisation you're interested in and follow the link beneath the charts and tables.
-
'Brilliant' 'Shocking' 'Indispensable'
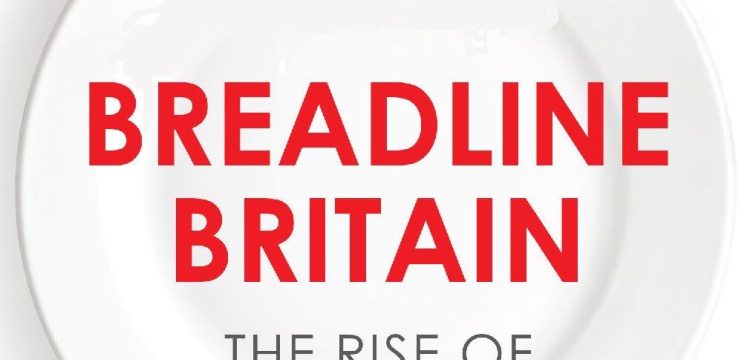
Breadline Britain - the rise of mass poverty, by Stewart Lansley and Joanna Mack, asks:
Why over the last thirty years has poverty doubled when the UK is twice as rich as it was?
One World, just £9.99
Find out more in PSE books
-
-
Who lacks the necessities of life?
How many children don't have a holiday?
What percentage of households can't heat their home?
How has it changed?
New tables on deprivation in:

-
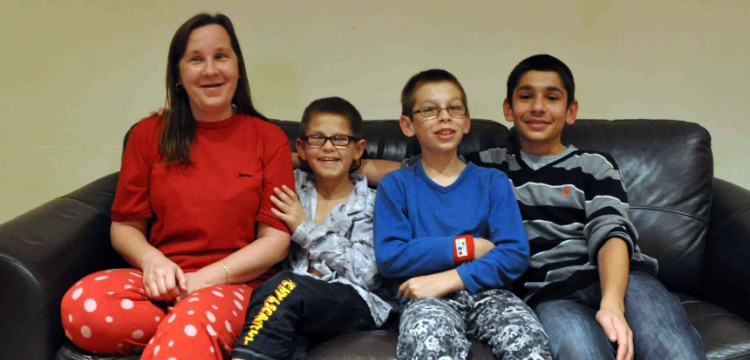
"I do without for the children so they have proper meals."
28%
of adults skimp on their own food to feed others
 Hear Jennie's story
This section provides an opportunity to examine key data from the PSE: UK 2012 'Attitudes to the Necessities of Life and Services' survey and the 'Living Standards' survey. In most tables, you can control aspects of the view you look at. In some of the tables, you can also download the data as .csv files.
In the left hand menu:
- Tables 1.1 to 1.6 explore the findings on people's attitudes to and trends in attitudes to necessities in the UK and Britain.
- Tables 2.1 to 2.6 looks at deprivation in the UK/Britain. Tables 2.1 to 2.4 explore those who go without each of the necessities and tables 2.5 to 2.6 explore those going without multiple necessities. See the Deprivation tables overview for further details on how these tables are constructed.
- Tables 3.1 to 3.5 look at Northern Ireland with tables 3.1 to 3.4 examining attitudes to necessities and table 3.5 looking at experiences of the ‘Troubles’.
Please credit PSE: UK 2012 for any data used.
The PSE UK Living Standards survey is the largest survey into poverty and deprivation in the UK ever undertaken and covered 5,193 households (4,205 in Britain and 988 in Northern Ireland) in which 12,097 people were living (9,786 in Britain and 2,311 in Northern Ireland). This enables details analysis of the various groups within the population as a whole.
PSE UK 2012 follows on from earlier surveys into attitudes to necessities and levels of deprivation in Britain, namely PSE Britain 1999, Breadline Britain 1990 and Breadline Britain 1983. In some of the tables, these earlier surveys are drawn on to look at trends.
For the tables that look at the findings by income, details of what’s included and the equivalence scales used for household income can be found in PSE income measure.
Further analysis and reports
For further commentary on this data see Key findings, PSE reports, in particular the PSE first report, The Impoverishment on the UK and the PSE report on Child Poverty and Social Exclusion, and Results analysis. Journal papers provides links to the wide range of academic papers published using the PSE 2012 data and Books provides details of the four books that have been based on this research project.
The full quesionnaires with top level results are in the Questionnaires section. Read more about the development of the surveys in the Methods development working papers
Survey details
The PSE UK 2012 'Attitudes to the Necessities of Life and Services' survey took place between May and June 2012, and the 'Living Standards' survey between March and December 2012. Both covered the whole of the UK. The 2012 Necessities of Life survey and the Living standards survey were both carried out by the National Centre for Social Research (NatCen) in Britain and by the Northern Ireland Statistics and Research Agency (NISRA) in Northern Ireland. The size and sampling frames for these surveys, along with that of the predecessor 'PSE Britain 1999', 'Breadline Britain 1990' and Breadline Britain 1983' surveys, can be found in PSE survey details.



 PSE:UK is a major collaboration between the University of Bristol, Heriot-Watt University, The Open University, Queen's University Belfast, University of Glasgow and the University of York working with the National Centre for Social Research and the Northern Ireland Statistics and Research Agency. ESRC Grant RES-060-25-0052.


